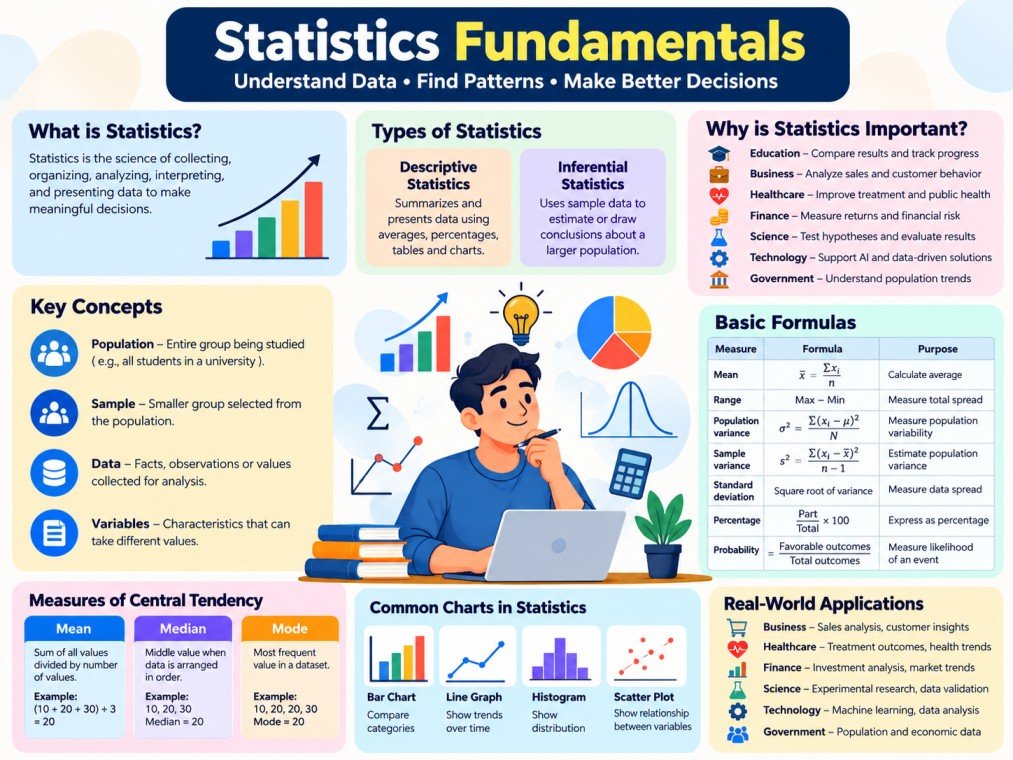
Statistics fundamentals help us understand data, identify patterns, compare information, and make informed decisions. From analyzing business performance and interpreting scientific research to understanding sports results and financial trends, statistics plays an important role in everyday life.
Whether you are a student, researcher, business owner, or beginner learning data analysis, understanding basic statistical concepts provides a strong foundation for more advanced topics.
In this guide, you will learn what statistics is, its main types, essential formulas, practical examples, and how to use statistics to interpret real-world data.
What Are Statistics Fundamentals?
Statistics fundamentals are the basic principles and methods used to collect, organize, analyze, interpret, and present data. They help transform raw information into meaningful insights that support decision-making.
For example, a teacher may calculate the average marks of a class to evaluate student performance. A business owner may analyze monthly sales figures to identify the most profitable products. A researcher may use statistical methods to evaluate the results of a study.
Statistics generally involves two major branches:
- Descriptive statistics: Summarizes and presents data using averages, percentages, tables, charts, and other measures.
- Inferential statistics: Uses information from a sample to estimate or draw conclusions about a larger population.
Understanding these two branches is the first step toward learning statistics effectively.
Why Are Statistics Important?
Statistics allows people to make decisions based on evidence rather than assumptions. It simplifies complex datasets and reveals patterns that might otherwise remain hidden.
Important applications of statistics include:
- Education: Comparing examination results and measuring student progress.
- Business: Evaluating sales, customer behavior, profits, and marketing campaigns.
- Healthcare: Analyzing clinical research, treatment outcomes, and public health trends.
- Finance: Measuring investment returns, financial risk, and market performance.
- Science: Testing hypotheses and evaluating experimental results.
- Technology: Supporting machine learning, artificial intelligence, and data-driven applications.
- Government: Understanding population trends, employment rates, and economic indicators.
Learning statistics fundamentals develops analytical thinking and makes it easier to understand reports, research papers, and numerical data.
Basic Statistical Concepts You Should Know
1. Population and Sample
A population is the entire group that a researcher wants to study. A sample is a smaller group selected from that population.
For example, if a university has 5,000 students and a researcher surveys 300 students about their study habits:
- Population: All 5,000 students.
- Sample: The 300 students surveyed.
Researchers often study samples because collecting information from an entire population can be expensive, time-consuming, or impractical.
A representative sample helps researchers draw more reliable conclusions about the population.
2. Data and Variables
Data refers to facts, observations, measurements, or values collected for analysis. A variable is a characteristic that can take different values.
The two main types of data are:
- Qualitative data: Describes categories or characteristics, such as product color, city, or customer satisfaction level.
- Quantitative data: Represents numerical measurements or counts, such as age, income, temperature, or sales volume.
Quantitative variables can be further classified as discrete or continuous.
A discrete variable takes countable values, such as the number of students in a classroom. A continuous variable can take any value within a range, such as a person’s height or the time required to complete a task.
3. Mean, Median, and Mode
Mean, median, and mode are measures of central tendency. They describe the center or typical value of a dataset.
Mean (Average)
The mean is calculated by adding all observations and dividing the total by the number of observations.
Formula:
Mean = Sum of all values ÷ Number of values
Example: For 10, 20, and 30:
Mean = (10 + 20 + 30) ÷ 3 = 20
Median (Middle Value)
The median is the middle value when the data is arranged in ascending or descending order.
Example: For 10, 20, and 30, the median is 20.
If a dataset has an even number of observations, the median is the average of the two middle values.
Mode (Most Frequent Value)
The mode is the value that occurs most frequently in a dataset.
Example: For 10, 20, 20, and 30, the mode is 20.
The mean can be affected by extreme values, while the median is often more representative when a dataset contains unusually high or low observations.
4. Range, Variance, and Standard Deviation
Measures of dispersion describe how spread out data values are.
Range
The range is the difference between the largest and smallest values.
Formula:
Range = Maximum value − Minimum value
Example: If test scores are 45, 60, 75, and 90:
Range = 90 − 45 = 45
Variance
Variance measures the average squared deviation of observations from the mean. A larger variance generally indicates that the data is more spread out.
Standard Deviation
Standard deviation is the square root of variance. It measures data variability in the same units as the original observations.
A low standard deviation indicates that values are relatively close to the mean. A high standard deviation indicates greater variation.
These measures are useful when comparing examination results, product quality, financial returns, and business performance.
Essential Statistics Formulas
Learning basic statistical formulas helps you solve common problems and interpret numerical information accurately.
| Statistical Measure | Formula | Purpose |
|---|---|---|
| Mean | x̄ = Σxᵢ / n | Calculates the average |
| Range | Maximum − Minimum | Measures the total spread |
| Population variance | σ² = Σ(xᵢ − μ)² / N | Measures population variability |
| Sample variance | s² = Σ(xᵢ − x̄)² / (n − 1) | Estimates population variance |
| Standard deviation | Square root of variance | Measures data spread |
| Percentage | (Part / Total) × 100 | Expresses a proportion as a percentage |
| Probability | Favorable outcomes / Total equally likely outcomes | Measures the likelihood of an event |
In these formulas, xᵢ represents an individual observation, n represents the sample size, N represents the population size, x̄ is the sample mean, and μ is the population mean.
Sample variance uses n − 1 in the denominator to provide the standard unbiased estimator of population variance under the usual independent random-sampling assumptions.
Practical Example: Calculating Mean, Median, and Range
Suppose five students receive the following examination scores:
70, 75, 80, 85, 90
Step 1: Calculate the mean.
Mean = (70 + 75 + 80 + 85 + 90) ÷ 5
Mean = 400 ÷ 5 = 80
Step 2: Find the median.
The scores are already arranged in ascending order. The middle score is 80.
Step 3: Calculate the range.
Range = 90 − 70 = 20
The final results are:
- Mean: 80
- Median: 80
- Range: 20
This example demonstrates how basic statistics can summarize a dataset using a few simple calculations.
What Is Probability in Statistics?
Probability is a mathematical measure of how likely an event is to occur. It ranges from 0 to 1, where 0 represents an impossible event and 1 represents a certain event.
For example, when rolling a fair six-sided die, the probability of getting a 4 is:
P(4) = 1/6 ≈ 0.167
This is approximately 16.7%.
Probability is important in statistical inference because it helps researchers quantify uncertainty, evaluate hypotheses, and estimate the likelihood of different outcomes.
Probability calculations depend on their assumptions. Real-world events do not always have equally likely outcomes.
Descriptive Statistics vs. Inferential Statistics
Although both branches analyze data, they serve different purposes.
| Feature | Descriptive Statistics | Inferential Statistics |
|---|---|---|
| Main purpose | Summarizes observed data | Draws conclusions about a population |
| Common methods | Mean, median, charts, standard deviation | Confidence intervals, hypothesis tests, regression |
| Data focus | The dataset being analyzed | A sample used to learn about a larger population |
| Example | Calculating average customer spending | Estimating average spending for all customers |
For example, a company may calculate the average purchase value of 500 customers. This is descriptive statistics.
If the company uses those 500 customers to estimate average purchase value across its entire customer base, it is applying inferential statistics.
Inferential conclusions depend on sampling quality, assumptions, and uncertainty. A larger sample alone does not eliminate selection bias.
Understanding Hypothesis Testing
Hypothesis testing is a statistical method used to evaluate a claim about a population using sample data.
It commonly involves two statements:
- Null hypothesis (H₀): The default claim, often stating that there is no effect or difference.
- Alternative hypothesis (H₁): The claim that an effect, difference, or relationship exists.
For example, a company wants to determine whether a new advertising campaign increases average sales.
The null hypothesis might state that the campaign does not change average sales, while the alternative hypothesis states that average sales increase.
A statistical test produces a result that researchers evaluate using a significance level, often 0.05. If the p-value is below that threshold, the null hypothesis is rejected under the chosen testing procedure.
A p-value is not the probability that the null hypothesis is true. Statistical significance also does not automatically mean that an effect is large, practically important, or caused by the intervention.
Correlation and Regression: Understanding Relationships
Correlation and regression help analyze relationships between variables.
Correlation
Correlation measures the direction and strength of a linear relationship between two numerical variables. The Pearson correlation coefficient ranges from −1 to +1.
- A value near +1 indicates a strong positive linear relationship.
- A value near −1 indicates a strong negative linear relationship.
- A value near 0 indicates little or no linear relationship.
A correlation near zero does not rule out a nonlinear relationship.
Regression Analysis
Regression models how an outcome variable relates to one or more explanatory variables. It can help estimate relationships, predict outcomes, and evaluate how variables change together.
For example, a business may use regression to examine the relationship between advertising spending and sales revenue.
An important principle is that correlation does not prove causation. Other variables or underlying factors may explain an observed relationship.
Common Statistical Charts and Graphs
Data visualization makes statistical findings easier to understand. Different charts are suitable for different types of information.
1. Bar Chart
A bar chart compares categories, such as sales across different products or the number of students in different classes.
2. Line Graph
A line graph displays changes over time, such as monthly revenue, daily website visitors, or annual population growth.
3. Histogram
A histogram displays the distribution of numerical data by grouping values into intervals. It helps identify patterns and variations in a dataset.
4. Scatter Plot
A scatter plot illustrates the relationship between two numerical variables and can help identify correlations, clusters, and outliers.
Choosing the right chart makes statistical information easier to interpret and communicate.
How to Learn Statistics Fundamentals as a Beginner
You do not need to master advanced mathematics immediately. Start with simple concepts and gradually build your understanding.
- Learn basic terminology. Understand population, sample, variables, and different types of data.
- Practice descriptive statistics. Calculate the mean, median, mode, range, and standard deviation.
- Study probability. Learn how to calculate the likelihood of simple events.
- Explore data visualization. Practice reading tables, bar charts, line graphs, and histograms.
- Understand statistical inference. Learn confidence intervals, hypothesis testing, and sampling.
- Work with real datasets. Analyze examination scores, sales records, survey results, or publicly available datasets.
- Use statistical tools. Practice with Microsoft Excel or Google Sheets, then explore Python or R for more advanced analysis.
Consistent practice with small datasets is one of the most effective ways to develop statistical reasoning.
Common Mistakes to Avoid When Studying Statistics
Beginners can improve their understanding by avoiding several common errors.
- Confusing correlation with causation: Two variables moving together does not prove that one causes the other.
- Ignoring outliers: Extreme values can influence averages, standard deviations, and statistical models.
- Using an unrepresentative sample: Biased samples can lead to misleading conclusions about a population.
- Misinterpreting p-values: A p-value does not measure the size or practical importance of an effect.
- Choosing inappropriate charts: Different data types require different visualization methods.
- Reporting results without context: Statistical values should be interpreted alongside sample size, measurement methods, uncertainty, and relevant assumptions.
Understanding these limitations is just as important as memorizing formulas.
Frequently Asked Questions About Statistics Fundamentals
What are the five basic concepts of statistics?
Five important foundational concepts are population and sample, data types and variables, measures of central tendency, measures of dispersion, and probability. These concepts prepare learners for more advanced statistical analysis.
What are the four main types of statistics?
Statistics is commonly divided into two major branches: descriptive and inferential statistics. Probability and statistical modeling are also important areas studied in introductory courses. These are useful learning categories rather than a universally fixed classification.
Is statistics difficult for beginners?
Statistics can seem challenging at first, but beginners can develop a solid understanding by learning concepts in sequence and practicing with simple examples. Basic arithmetic and careful interpretation are sufficient to get started; advanced topics may require algebra and additional mathematics.
What is the difference between a statistic and a parameter?
A statistic is a numerical value calculated from a sample, such as the average score of 100 selected students. A parameter describes an entire population, such as the average score of every student in a university.
Which tools are useful for learning statistics?
Excel and Google Sheets are useful for basic calculations and charts. Python libraries such as pandas, NumPy, SciPy, and statsmodels support more advanced analysis. R is another popular tool for statistical computing and visualization.
Why are statistics important in data science and AI?
Statistics supports data analysis, uncertainty estimation, experimental design, model evaluation, and many machine-learning methods. It helps practitioners distinguish meaningful patterns from random variation and evaluate how reliably a model performs.
Conclusion
Statistics fundamentals provide the foundation for understanding data, evaluating evidence, and making informed decisions. By learning population and sample, mean and median, variance and standard deviation, probability, hypothesis testing, correlation, and regression, beginners can develop essential analytical skills.
The best way to learn is to combine formulas with practical examples and real datasets. As your knowledge grows, you can apply statistical methods to education, business, healthcare, finance, scientific research, and artificial intelligence.
Whether your goal is academic success or a career in data analysis, mastering statistics fundamentals is a valuable first step toward making better decisions with data.